FUNCTIONAL CONNECTIVITY IDENTIFIES AN EPILEPTOGENIC NETWORK IN IDIOPATHIC GENERALISED EPILEPSY
Abstract number :
2.326
Submission category :
Year :
2004
Submission ID :
4775
Source :
www.aesnet.org
Presentation date :
12/2/2004 12:00:00 AM
Published date :
Dec 1, 2004, 06:00 AM
Authors :
Graeme D. Jackson, Anthony B. Waites, Regula S. Briellmann, Angelo Labate, Richard Masterton, and David F. Abbott
Analysis of simultaneous EEG and functional MRI has given insight into the brain regions involved in seizure generation. The first purpose of this study was to analyse spikes that appeared different on the EEG to determine if the underlying brain activation was different. The second aim was to use other analysis approaches, including connectivity analysis and temporal clustering analysis (TCA), to further probe the epileptic circuits that underlie abnormal brain activity. fMRI studies used a 3 tesla GE Signa LX scanner (GE, Milwaukee, WI). Functional images were acquired as a series of gradient-recalled echo planar imaging (GR-EPI) volumes (TR/TE=3600/40ms, flip angle=60 degrees, 25 oblique slices 4mm thick+1mm gap, 24cm FOV, 128x128 matrix), over a period of one hour (1200 volumes).
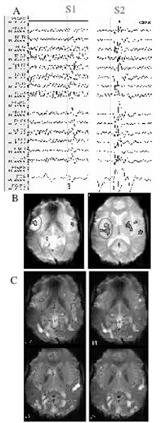
We assessed a patient with idiopathic generalized epilepsy, her EEG analysis identified two types of spikes, called S1 and S2 (Fig A). Simultaneous fMRI/EEG was analysed using SPM99 (www.fil.ion.ucl.ac.uk/spm). Event-related analysis was performed to obtain maps of involved brain voxels for S1 and S2. The points of maximum statistic from each map were used as seeds in a functional connectivity analysis. The timecourse of each region (filtered to remove high frequency noise [gt]0.08Hz) was correlated against all brain voxel timecourses. Connectivity maps were then contrasted statistically against control maps, obtained by seeding these regions in four healthy controls. TCA analysis detected times when many voxels reach their maximal signal, and used these timepoints in an event-related analysis. Panel B shows the BOLD activation from the EEG/fMRI study (S1 on the left, S2 on the right). The S1 spikes showed primarily deactivation in the insular cortex. The S2 spikes showed activation in subcortical nuclei, primarily the basal ganglia.
Panel C shows the increased connectivity above normal (control) levels measured statistically, based on the seed areas circled in panel B. Note that the areas involved in the connectivity pattern are virtually identical for each spike type, despite the seed point and the BOLD activation pattern being different. The TCA results show a pattern very similar to the network identified using connectivity analysis, together with some other brain regions.[figure1] These data support the idea that interictal epileptiform events are an expression of activity in an epileptogenic network and the different EEG pattern may merely reflect peak activity in different parts of this network. (Supported by Neurosciences Victoria and National Health and Medical Research Council)
